


Service hotline
+86 18518316054
 Current location : Home page > Resources > Papers > Highly efficient Pt/NaNbO3 nanowire photocatalyst: Its morphology effect and application in water purification and H2 production
Qianqian Liu, Yuanyuan Chai, Lu Zhang, Jia Ren, Wei-Lin Dai*
Department of Chemistry and Shanghai Key Laboratory of Molecular Catalysis and Innovative Materials, Fudan University, Shanghai 200433, P. R. China
Graphical abstract
Highlights
Pt nanoparticles (NPs) supported on wire- and cube- like NaNbO3
A facile hydrothermal route combined with in situ photodeposition method
Nanowire exhibited 25 times higher H2 production than nanocube.
Super stability up to 15 h in the process of photocatalytic H2 production
Better distribution of Pt NPs and much stronger interaction of Pt and NaNbO3
Abstract
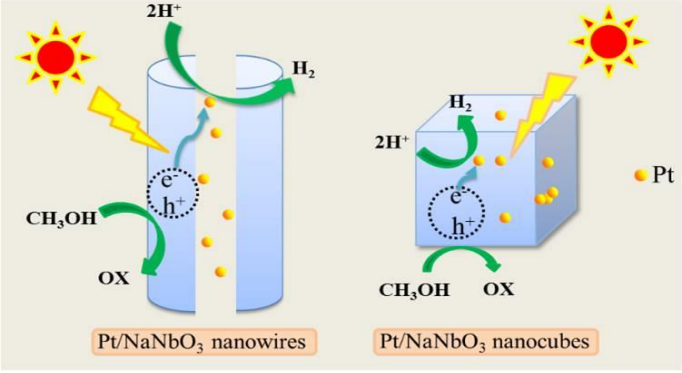
Pt nanoparticles (NPs) supported on wire- and cube- like NaNbO3 were successfully synthesized by a facile hydrothermal route combined with in situ photodeposition method. Photocatalytic performances towards photocatalytic H2 production and organic-pollutant degradation of NaNbO3 with morphology of nanowire and nanocube, with or without support of Pt NPs were comparatively investigated. In addition, special attention was paid to investigate the influence of the morphologies on the photocatalytic performance of Pt/NaNbO3 systems. It was found that, by incorporation of Pt NPs, Pt/NaNbO3 systems show much higher activity than their counterparts. Moreover, by contrast with Pt/NaNbO3 nanocube, the Pt NPs tend to be better uniformly dispersed on NaNbO3 nanowire while prefer to agglomeration on NaNbO3 nanocube, resulting in more direct contact between Pt NPs and NaNbO3 nanowire. Meanwhile, it was found that the stronger interaction of Pt NPs and NaNbO3 nanowire, confirmed by XRD, Raman spectroscopy and XPS, significantly enhanced the electron transfer between NaNbO3 nanowire and Pt NPs, and hence further increased the separation efficiency of electron-hole pair. Thus, a remarkably enhanced photocatalytic activity of Pt/NaNbO3 nanowire than other materials has been realized, and this catalyst presented super stability as well. A deep insight into the underlying of the photocatalytic reaction mechanism was also proposed.
1. Introduction
Photocatalysis, based on its application in environment purification, waste water treatment, and water photo-splitting, has been regarded as a research focus in the field of environment science [1-4]. Among the promising photocatalysts, perovskite niobates, including NaNbO3, play a noticeable role because of their excellent properties, such as piezoelectric, ferroelectric, ionic conductive and photocatalytic properties [5-10]. Recently, NaNbO3 has been demonstrated as a promising photocatalytic material which can initiate photocatalytic water splitting under UV light irradiation [11]. However, it is usually synthesized by a conventional solid-state reaction or molten salt synthesis routes, which needs high sintered temperature [12-14]. Therefore, the synthesis of NaNbO3 with controllable structure by hydrothermal process is an effective and attracting attempt because an outstanding advantage of such a hydrothermal method is that the reaction temperature required is much lower than those in other ways. However, the low quantum efficiencies and high band gap (3.0-4.7 eV) of niobates still significantly restrict their practical applications in photocatalysis [15].
In order to improve the photocatalytic activity of niobates, a metal particles (such as Au, Ag and Pt) /semiconductor system has exhibited significant promise. Because on the one hand, the conduction electrons of semiconductor could be injected into the noble metals with the fermi energy (EF) lower than the semiconductor conduction band potential through the metal/semiconductor interface, and these electrons are effectively involved in catalysis [16-19]. Yet on the other hand, growth of metals on semiconductors contributes to the improvement of charge separation efficiency of the two materials due to the energy band alignment. Thus, many metal/semiconductor composite photocatalysts have been proposed, such as Ag-NaTaO3 hybid [20], Au loaded KNbO3 [16] and Au loaded TiO2 [21-22]. Synergistic effects are expected to play a key role in enhancing the photocatalytic performance.
The main focus in the synthesis of metal particles/semiconductor materials is precisely controlling the structure of semiconductor [23-26], since the photocatalytic properties are closely related to the morphology and the microstructure of the material [27]. For example, Ruan et al. have reported that the photocatalytic activity of Bi2Fe4O9 nanosheets towards the degradation of methyl orange is higher than that of Bi2Fe4O9 microplatelets [28]. However, to date, there are limited studies on the photocatalytic efficiency of metal particles loaded on niobates with disparate morphologies. It is commonly accepted that the morphologies have great influence on their light harvesting ability and activity site number as well as the accessibility to the active sites [29]. Especially, one-dimension (1D) materials, such as nanowire, have gained intensive attention due to their high aspect ratio, quantum refinement effects and much more active sites which are expected to show much higher photocatalytic activities [30-31]. Thus, based on these advantages, the introduction of metal particles in niobates with controllable morphologies would possibly result in significant differences in photocatalytic performance.
In this work, heterostructured Pt/NaNbO3 nanowires and nanocubes were respectively prepared via a simple hydrothermal treatment method combined with the photodeposition. Special attention was paid to investigate the influence of the morphologies on the photocatalytic performance of Pt/NaNbO3 systems. The contrast of synergistic effects between Pt nanoparticles and NaNbO3 nanowire or nanocube was discussed. Their photocatalytic activities were studied for water splitting as well as degrading organic dyes under sunlight irradiation. Additionally possible mechanism of Pt/NaNbO3 systems in the photocatalytic process were discussed and proposed in detail
2. Experimental
2.1. Preparation of NaNbO3 and Pt/NaNbO3
NaNbO3 nanowire. Nb2O5 (4N, Sinopharm Chemical Reagent Co. Ltd) and NaOH (AR, Sinopharm Chemical Reagent Co. Ltd) were involved in the synthesis. In a typical procedure, 1.0 g of Nb2O5 and 10 M NaOH were dissolved in 60 mL of deionized water. After 1 h of magnetic stirring, the obtained mixture was autoclaved at a temperature of 180°C (hydrothermal reaction) for 2 h to yield white niobate solids. Soon afterwards, the white precipitate was washed with deionized water and pure ethanol several times to remove the residues and then dried at 100°C overnight. Finally, the product was calcined at 600°C for12 h.
NaNbO3 nanocube. The procedure was the same as that of NaNbO3 nanowire except that the hydrothermal treatment time was 3 h.
Pt/NaNbO3 nanowire and nanocube. 0.3 g of NaNbO3 nanowire or NaNbO3 nanocube were dispersed into 40 mL of deionized water, and 1.6 mL of aqueous H2PtCl6·6H2O solution (10 mg/ mL) was added. Then, the resulting suspension was illuminated by 300 W Xe light at room temperature for 4 h under magnetic stirring. Afterwards, the product was filtered and washed several times with deionized water. Finally, the precipitate was dried at 80°C for 12 h in an oven, and the theoretical Pt loading in the products is 2 wt%. Besides, for Pt/NaNbO3 nanowire, the Pt loading has been adjusted by changing the H2PtCl6·6H2O concentration to optimize the best Pt amount.
2.2. Characterization of the catalysts
Scanning electron micrographs (SEM) were obtained using a PHILIPS XL 30 microscope operating at accelerating voltage of 20 kV. TEM images were performed on a JOEL JEM 2010 transmission electron microscope. The samples were supported on carbon-coated copper grids for the experiment. XRD patterns were obtained on a Bruker D8 advance spectrometer with Cu Kα radiation (λ = 0.154 nm), operated at 40 mA and 40 kV, respectively. The Laser Raman experiments were performed with a Jobin Yvon Dilor Labram I Raman spectrometer equipped with a holographic notch filter, CCD detector, and He-Ne laser radiating at 632.8 nm. XPS was performed using a RBD 147 upgraded Perkin Elmer PHI 5000C ESCA system equipped with a dual X-ray source, of which the Mg Kα (1253.6 eV) anode and a hemispherical energy analyzer was used. The background pressure during data acquisition was maintained at <10−6 Pa. Measurements were performed at a pass energy of 93.90 eV. All binding energies were calibrated using contaminant carbon (C 1s = 284.6 eV). Photoluminescence (PL) spectra were carried out on a JASCO FP-6500 type fluorescence spectrophotometer. Electrochemical impedance spectroscopy (EIS) experiment was carried out on a ZENNIUM electrochemical workstation (Zahner, Germany). EIS was conducted in a frequency range of 200 kHz to 5 MHz for 10 mV in DC potential of open circuit potential (OCP) after a 10 min delay. Ultraviolet visible (UV-vis) diffuse reflectance spectra (DRS) spectra were recorded on a SHIMADZU UV-2450 instrument with a collection speed of 40 nmmin−1 using BaSO4 as the reference.
2.3. Photocatalytic test
Water-splitting reaction was carried out in a top irradiation vessel connected to a glass closed gas circulation system. 100 mg of the photocatalyst was dispersed in 100 mL aqueous solution containing 20% CH3OH scavenger in volume. The reactant solutions were degassed several times to remove air and then irradiated with a 300W Xe arc lamp (CeauLight, CEL-HXF300) at room temperature. The amount of H2 was analyzed by gas chromatograph equipped with a thermal conductivity detector (TCD) and a 5 A molecular sieve column, using Ar as the carrier gas.
Photodegradation experiments were performed in a beaker placed under the lamp bracket, containing reaction solution of RhB or 4-CP (10 mg/L, 100 mL) and 100 mg of catalyst powder. The photo-reactor was equipped with a cooling jacket to maintain the temperature at 25C and a 300W Xe arc lamp (CeauLight, CEL-HXF300). In the experiments, the solution was stirred in dark for 30 min to achieve the adsorption/desorption equilibrium. After turning on the lamp, 5 mL of solution was sampled at certain time intervals and centrifuged for UV-visible absorption spectrum measurements
3. Results and discussion
3.1. Characterization
NaNbO3, known as one of the perovskite family, contains a network of corner-shared octahedral units of [NbO6] (as described in Scheme 1) [32-34], which is helpful for the enhancing of charge migration in the crystals. The formation routes of the catalysts were illustrated also in Scheme 1. As shown, the hydrothermal time plays a key role to control NaNbO3 with different morphological characteristics, as NaNbO3 nanocubes are thermodynamically more stable than the crystal of the nanowires [35], longer reaction time is beneficial for the transformation from NaNbO3 nanowire to NaNbO3 nanocube. Thus, the total transformation of wires to cubes could be observed when the hydrothermal treatment time was extended to 3 h. Finally, after the photo-reduction deposition of Pt NPs, the gray nanocomposites of Pt/NaNbO3 nanowire and Pt/NaNbO3 nanocube were successfully prepared.
The morphology of the NaNbO3 nanowire and Pt/NaNbO3 nanowire were observed by SEM, TEM and HRTEM analyses. The SEM analyses in Fig. 1a and Fig. S1 show a large amount of NaNbO3 nanowires with a uniform diameter of about 100 nanometers and length of up to several tens micrometers. TEM images (Fig. 2a) reveal that Pt NPs (black spots) are homogeneously dispersed on the surface of NaNbO3 nanowires and their average diameter is 1.2 nm. High-resolution TEM(HRTEM) images (Fig. 2b), taken from the region marked in Fig. 2a, demonstrate both the NaNbO3 nanowires and the Pt NPs are well crystallized, as evidenced by the clear lattice fringes of 0.392, 0.271 and 0.221 nm, which corresponds to the (101), (200) facet of NaNbO3 and (111) facet of Pt NPs, respectively. What’s more, a close contact between Pt NPs and NaNbO3 nanowires is observed, which is beneficial for the separation of photo-induced electron-hole pairs. In addition, a selected area electron diffraction (SAED) pattern (inset of Fig. 2b) reveals the NaNbO3 nanowire is of single crystal. And Na, Nb, O and Pt elements clearly emerge in the heterostructures of Pt/NaNbO3 nanowire (seen in X-ray energy dispersive spectroscopy (EDS) elemental mapping (Fig. 2c and 2d)), indicating the successful combination of Pt NPs with NaNbO3 nanowires. Noticeably, the distribution of all the elements is homogeneous and uniform, which is consistent with the results of TEM (Fig. 2a)
By contrast, the SEM images of NaNbO3 nanocube in Fig. 1b reveal that cube-like NaNbO3 with size ranges from 0.5 to 1.5 μm has been successfully prepared. HRTEM images (Fig. 2f) demonstrate that NaNbO3 nanocubes with (200) crystalline lattices and Pt NPs with (111) crystalline lattices are highly crystallized, and single crystal is also confirmed by SAED pattern (inset of Fig. 2f). In contrast with the Pt/NaNbO3 nanowire, it is noticed that Pt NPs with mean diameter of 1.9 nm prefer to agglomeration on the surface of NaNbO3 nanocubes (Fig. 2e), which would result in less direct contact between Pt NPs and NaNbO3 nanocubes, thus further hindering the separation of electron-hole pairs. In addition, elemental mapping analysis (Fig. S2) further disclosed the inferior dispersion of Pt NPs on the surface of NaNbO3 nanocubes
Therefore, according to the above comparison and analysis, we found that Pt NPs tend to better disperse on NaNbO3 nanowires while prefer to agglomerate on NaNbO3 nanocubes. The HRTEM images show that NaNbO3 nanowires exhibited two kinds of lattice fringe directions of (101) and (200). While only one kind of lattice fringe directions attributed to (200) planes was observed for the nanocubes, suggesting that the nanocubes just exposed (200) planes. Maybe the high percentage of (101) facets in NaNbO3 nanowires is responsible for their better dispersibility. Just like Ding et al. reported that silver nanoparticles were highly dispersed on the (001) facets of the WO3-110 support while came to aggregate on the (010) and (100) facets of WO3 nanorods [36]. It is commonly accepted that a better dispersion of Pt NPs contributes to the more direct contact of Pt NPs and NaNbO3 nanowire, which is beneficial for the absorbance of more sunlight as well as the improvement of light-utilization efficiency of Pt/NaNbO3 nanowire.
Additionally, based on the results of ICP-AES (Table 1), the weight percentages of Pt in 2 wt % Pt/NaNbO3 nanowire and nanocube are measured to be 1.75 and 1.67, which was approximate to the theoretical loadings. However, the surface Pt content calculated from the XPS for Pt/NaNbO3 nanowire is obviously much lower than that of Pt/NaNbO3 nanocube. Given the determined bulk percentage of Pt, we found that the Pt NPs tend to penetrate into the lattice of NaNbO3 nanowire, while prefer to appear on the surface of NaNbO3 nanocube.
In order to verify the above speculation, XRD technique was carried out. As shown in Fig. 3, the characteristic diffraction peaks of NaNbO3 nanowire (Fig. 3d) and NaNbO3 nanocube (Fig. 3b) match well with the standard card of orthorhombic phase (JCPDS 33-1270). However, no signal of metallic Pt phase can be detected in Pt-NaNbO3 systems because of the small crystallite size and low Pt content. Moreover, by comparing with pure NaNbO3 nanowire, slightly characteristic diffraction peak shifts of Pt/NaNbO3 nanowire are observed (inset of Fig. 3), indicating that Pt NPs incorporate into the lattice of NaNbO3 nanowire. The lattice parameter calculated by Rietveld refinement of the XRD data shows that, for Pt/NaNbO3 nanowire, this value becomes smaller in (100) and (010) directions, but increases in (001) compared to that of pristine NaNbO3 (Table 2), indicating the lattice shrinkage induced by Pt incorporated into the lattice of NaNbO3 nanowire. Meanwhile, by contrast, no diffraction pattern shifts can be seen in Pt/NaNbO3 nanocube, suggesting very few Pt NPs penetrate into the lattice of NaNbO3 nanocube, which is consistent with the results of Table 1. On the other hand, the observed shifts demonstrate the strong interaction between Pt NPs and NaNbO3 nanowire. It is known that strong metal-support interaction may promote electron transfer and further enhance the separation of electron-hole pairs, thus contributing to the enhancement of photoactivity over Pt/NaNbO3 nanowire [37-40]. However, no shifts of Pt/NaNbO3 nanocube may result from the weaker metal-support interaction between Pt NPs and NaNbO3 nanocube.
Raman spectroscopy, known as an appropriate technique for the investigation of the short-range order, phase structure and space group in perovskites, is employed to further analyze the crystalline phase of the as-prepared products. As shown in Fig. 4, the strongest band near 600 cm-1 corresponds to the stretching model of Nb-O octahedron. After Pt NPs incorporates, the characteristic band shifts to higher wavenumber and is remarkably broadened (Fig. 4c and 4d). The observed shift and broadening can be assigned to the incorporation of Pt NPs into the lattice of NaNbO3, which is consistent with the XRD result. Clearly, the shift of Pt/NaNbO3 nanowire is much higher than Pt/NaNbO3 nanocube, further illustrating the interaction of the former is much stronger than the latter. On the other hand, it is known that the Raman shifts for stretching is closely related to the Nb-O bond lengths in crystalline inorganic niobate compounds. And the higher wavenumber for the Raman stretching bands corresponds to shorter Nb-O bond lengths [41-44]. Thus, the observed shifts in Fig. 4 can be ascribed to the changes of Nb-O bond lengths. It has been reported that the O 2p and Nb 4d orbital mainly contribute to the formation of the valence and conduction bands of NaNbO3 [45]. Therefore, the changes in the NbO6 octahedra local structure, such as Nb-O bond lengths, may influence on the band structure of the NaNbO3, and thus resulted in the variation of the optical band gap, which would be discussed in the mechanism part.
To further investigate the chemical state of the as-prepared samples, XPS measurements were carried out and the results were shown in Fig. 5. From Fig. 5a, the Pt 4f spectrum can be deconvoluted into two peaks centered at around 70.7 eV (Pt 4f7/2) and 74.1 eV (Pt 4f5/2), which is the characteristic of metallic platinum, indicating that metallic platinum is formed in the product. Simultaneously, the Nb 3d spectra of NaNbO3 nanowire in Fig. 5b displays two signals at 207.8 eV (Nb 3d5/2) and 210.5 eV (Nb 3d3/2), suggesting that Nb is in the Nb (+5) chemical state. Compared to those of the pristine NaNbO3 nanowire, the Nb 3d peaks of Pt/NaNbO3 nanowire migrate to the direction of lower binding energy, indicating the presence of Pt NPs strongly interacts with NaNbO3 nanowire, which greatly facilitates the electrons transfer. Additionally, based on the report of Zhou et al. the reduction of Nb5+ can actually harvest the light energy more efficiently and this will be beneficial for the improvement of photocatalytic performance [46]. Whereas, as a contrast, the Pt 4f spectrum of Pt/NaNbO3 nanocube (Fig. 5c) can be split into four peaks. The binding energies of 70.6 and 74.0 eV are attributed to Pt 4f7/2 and Pt 4f5/2 of Pt metal, while the other peaks at approximate 73.3 and 76.7 eV are attributed to the platinum oxide layer, which covered the surface of Pt metal particles. The appearance of platinum oxide peaks apparently indicates Pt NPs are located on the surface of Pt/NaNbO3 nanocube. Consistently, in contrast with Pt/NaNbO3 nanowire, less peak shifts are observed in Nb5+ of Pt/NaNbO3 nanocube (Fig. 5d), further demonstrating the interaction between Pt and NaNbO3 nanowire is more stronger than that of Pt/NaNbO3 nanocube. This finding is consistent with the results of XRD and Raman spectroscopy.
3.2. Photocatalytic tests
The photocatalytic activities of the different samples were firstly estimated by the photocatalytic hydrogen evolution under mimic sunlight irradiation. As shown in Fig. 6a and 6b, a tremendously enhanced H2 evolution rate of 26.6 μmol h-1 is achieved on Pt/NaNbO3 nanowire, which is about 24 times and 8.3 times higher than that of Pt/NaNbO3 nanocube (1.1 μmol h-1 ) and pure NaNbO3 nanowire (3.2 μmol h-1), respectively. While NaNbO3 nanocube exhibits negligible activity (0.5 μmol h-1), ulteriorly manifesting the stronger interaction between Pt NPs and NaNbO3 nanowire (confirmed by the results from XRD, Raman spectroscopy and XPS) is beneficial for the separation of electron-hole pairs, and hence further contributes to the enhancement of photoactivity.
Additionally, the catalytic performance comparison of Pt/NaNbO3 nanowire in this work with the state-of-art record concerning NaNbO3 is shown in Table S1. As can be seen, the hydrogen production varies depending on different factors, including the reaction conditions, the mass of catalysts, nature of the support, irradiation wavelength, and others. A clear comparison of the results reported in the literatures is very difficult because of the obvious differences in the reaction processes. However, in the catalysts studied in this work, it is important to highlight the large amount of hydrogen produced under the same of reaction conditions, compared to previous works. The quantum yield was measured as about 0.53%, which was calculated using the formula listed in supporting information.
Except for the superior photocatalytic hydrogen production capacity of Pt/NaNbO3 nanowire, as demonstrated above, the photocatalytic aqueous-phase oxidations of RhB and 4-CP were also examined. As shown in Fig. 6c, dark absorption of RhB for 30 min reveals that the self-photolysis of RhB is negligible, and no adsorption phenomenon is observed in pure NaNbO3 and Pt/NaNbO3 systems. However, Pt/NaNbO3 nanowire presents appreciably much higher photocatalytic efficiency than pure NaNbO3 nanowire and Pt/NaNbO3 nanocube, while NaNbO3 nanocube exhibits even negligible activity. The trends are consistent with the photocatalytic hydrogen production. The apparent first-order-rate constant (k) for the photocatalytic degradation RhB is calculated based on a simplified Langmuir-Hinshelwood model (seeing Fig. S4a) [47]. It clearly demonstrates that the average reaction rate of Pt/NaNbO3 nanowire, about 0.025 min-1 , is much higher than that of pure NaNbO3 nanowire (0.003 min-1 ), Pt/NaNbO3 nanocube (0.001 min-1 ) and NaNbO3 nanocube (0.00016 min-1). Additionally, the photocatalytic degradation of 4-CP shows similar trends (Fig. S4b). Therefore, it can be concluded that Pt/NaNbO3 nanowire possesses dramatically enhanced activity in the photocatalytic hydrogen production as well as the decomposition of various pollutants.
Moreover, in order to explore the influence of Pt amount, the activity of Pt/NaNbO3 nanowire with different Pt loadings over the degradation of RhB is shown in Fig. S4c. The photocatalytic efficiency increases remarkably with the enhancement of Pt loadings, among which the Pt/NaNbO3 nanowire-2wt% composite exhibits the optimal photocatalytic activity, approximately 8 times as high as that of pure NaNbO3 nanowire. However, the further increase of Pt NPs amount would lead to the decrease of photocatalytic activity. This result may be due to the higher Pt loadings that lead to the aggregation of the Pt NPs, thus limiting the transfer of photogenerated charge carriers.
Generally, the long-term stability of a photocatalyst is of great significance for its further practical application. Thus, the catalytic stability of Pt/NaNbO3 nanowire was investigated under a prolonged photo-irradiation time up to 15 h in the process of photocatalytic H2 production. As shown in Fig. 6d, the activity of Pt/NaNbO3 nanowire is still retained over more than 90% of its original activity after three successive experimental runs, meaning the high stability against photocorrosion during photocatalytic H2 production reaction. In addition, its sufficient stability was further confirmed by the degradation of RhB, as shown in Fig. S4d, and the photocatalytic degradation efficiency of RhB is still higher than 90% even after 5 repeated runs.
Beijing China Education Au-light Co., Ltd.
Room 401, Fengtai Science and technology innovation center, No. 7 Kexing Road, Fengtai District, Beijing
+86 18518316054
eric@aulight.com;info@aulight.com

Scan and pay attention to us